How do I schedule in Branch view using the Histogram?
Follow these steps:
- Select Plan | Branches from the main menu to open up the branch view.
- Now, select the branch/sites/employees/hour types/pay levels that you wish to view using the pop up dialog boxes accessed by selecting

- Once selected, select Search.
- Now select Go To Histogram from the toolbar.
The following screenshot is a sample Histogram page, and a Histogram Legend explaining the meaning of the different 15 minutes colored segments for each of the seven days:
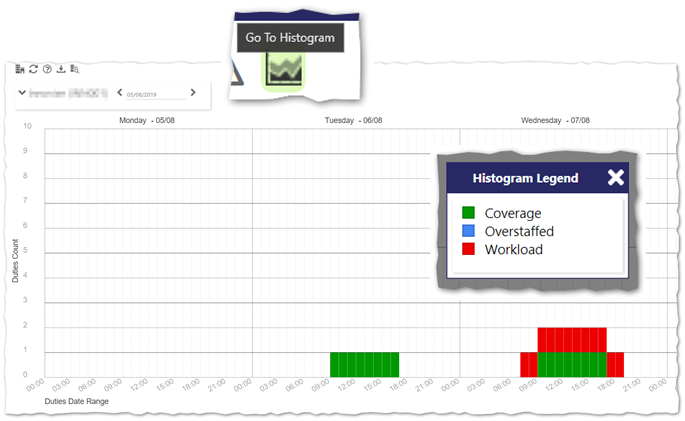
The histogram displays the number of employees that are working at a given time. A maximum of one week of data can be shown at any one time. Using the color scheme (as shown in the legend above) makes it easy to understand when the branch is understaffed due to workload exceeding the coverage metric. By looking at the visuals, you will be able to schedule duties more efficiently. This quick snapshot shows you the problem areas, so that can return to branch view and add/remove duties. From this screen you are also able to export your data - either as a colorful PDF file or a CSV file using the appropriate buttons at the top of the page.