How do I create a Template and a report using the Report Designer?
Note: This content is applicable to the legacy web version of Timegate.
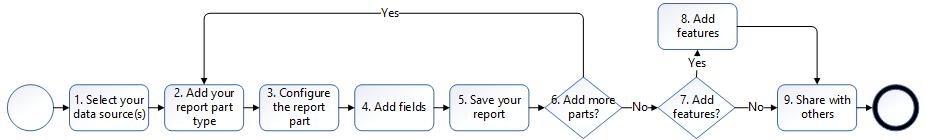
The following diagram shows the step-by-step process for creating a Template and report:
|
Process Step |
Description |
|
|---|---|---|
|
1. |
Select your data source(s) (and optionally save as a Template)
|
To start the process, you will select your data source(s) to create your Template. Selection is simple - a list is provided from which you choose your data sources. Once the sources are selected, you select Design to move onto the next stage To save as a Template:
|
|
2. |
Add your report part
|
A this point in the process, you must select how you would like your report to look. Select from the following built-in report parts:
|
|
3. |
Configure the report part
|
Once the report part is selected, it’s time to configure the way that it looks, using a variety of settings. Insights is highly configurable! The settings differ from report-type to report type i.e. if you select a chart, there is an initial choice of Chart Type (Line, Column, Bar, Area, Pie, Funnel, Donut, Combination, Tree Map, Heat Map, Bubble, Scatter, Waterfall and Sparkline). Depending upon the choice you make, you will be given a series of values to configure in the report body. For example, if you select Bar, the choices are: Title, Description, Labels (X-Axis), Labels (Y-axis) and Separators
|
|
4. |
Add fields
|
Select the fields that you wish to add, by dragging it from the left hand side of the screen to the report part. If you wish to add a calculated field, you should select +Add Calculated Field
|
|
5. |
Save your report
|
Select Save. You may wish to save to a category. These normally reflect your business area such as operations, payroll, finance etc.
|
|
6. |
Add more parts
|
You can add more than one part onto a report. If you wish to add extra parts, select + within the Report Body pane. Follow steps 2 - 5 for the new part, otherwise, proceed to Step 7.
|
|
7. |
Add features decision
|
There are numerous options to format your data to create a rich user experience. For instance, you could add Custom URLs, Alternative Texts, and even trigger JavaScript when a data label is clicked. At this point in the process, decide whether you wish to add features or not. If you wish to add features, proceed to Step 8, otherwise go to Step 9.
|
|
8. |
Add features
|
Add the advanced features that you wish to use. These can include Custom URLs, Alternative Texts, and triggering JavaScript when a data label is clicked. It can also include editing report parts with items such as Drill-Downs
|
|
9. |
Share with others
|
Before sharing with others, it is important to both add two security tables to the report for the Timegate Security Model to apply correctly. The two tables to add are dwUsersSiteCards AND dwUsersEmployees and add the joins. If you don’t do this the users will circumvent the security module – any user will be able to run the reports and get results even if they do not have the correct access rights in Timegate Select Save | Save Having saved the report, select the Access Permissions and review your sharing options, modifying as required
|