Analyze: Dashboards - Profit Variance
Note: This content is applicable to the legacy web version of Timegate.
How to get there: Analyze | Dashboards | Profit Variance Dashboard
This part of the guide gives an overview of the Profit Variance Dashboard. The Profit Variance Dashboard shows the variance in the profit for Gross and Net calculations. It organizes and presents information in a way that is easy to read and refine onscreen. Live data is gathered from all over the system before being combined and presented for the audience in an appropriate format.
When calculating a Net Profit Variance, Profit is looked at holistically - a positive profit from one duty for example can be set against a negative profit (loss) thus partially or entirely cancelling it out. An example of this would be a customer’s site with two duties. The first duty made a negative profit (loss) of£50 and another duty made a £50 the profit. The Net Profit Variance will be £0 (break-even) as the profit offsets the loss.
This analysis, however, hides the fact that there were variances overall. When these two values were “netted off” against each other, the site would not be highlighted as a problem when the user looks at the duty variance dashboards.
For this reason, there is a second view of the business,. This looks at the Gross Profit Variances (that are not “netted off” but instead added together). The Gross Profit Variances view will highlight areas of the business where there have been variances even when they have been “netted-off”.
To identify major contributors to overall variances the user should focus on Net Variances. However, it is prudent to periodically look at Gross Variances to where there is a lot going on, that gets “netted off”.
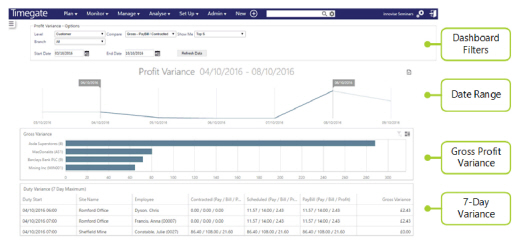
The screen is logically broken down into four sections - Dashboard Filters, Data Range, a Gross Profit Variance and the Variances within the last seven days as shown below:
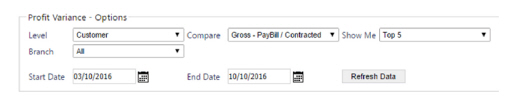
Dashboard Filters
Screen Layout, Fields and Actions
|
Level |
Drop-down list allowing the user to build the dashboard by branch, customer, site group or site card |
|
Branch |
Select the Branch to be analyzed from the drop-down list (or select all) |
|
Compare |
Gives the user the choice of what information that they wish to prepare. The choices are:
|
|
Show Me |
Gives the user the choice of what they wish to see:
|
|
Start Date |
Using the pop-up calendar, select the start date for the data to be analyzed in the dashboard |
|
End Date |
Using the pop-up calendar, select the end date for the data to be analyzed in the dashboard |
Screen Actions
|
Refresh Data |
Update the view based on the values entered into the dashboard filter |
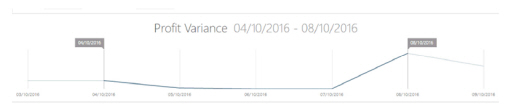
Date Range
Within this part of the screen, the user is able to modify the date ranges to display (as it contains the moveable slider that is employed to change the date ranges of the display).
Screen Layout
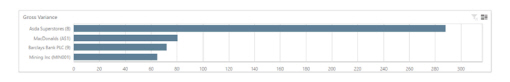
Gross Profit Variance
This part of the dashboard displays the Gross Profit Variance in a graphical format
Screen Layout
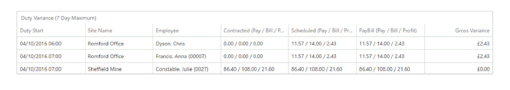
Variances Within The Last Seven Days
This part of the dashboard displays the variances within the last seven days. Clicking on columns will sort the data into an ascending or descending order
Screen Layout