Analyze: Dashboards - Historic Duty Statuses
Note: This content is applicable to the legacy web version of Timegate.
How to get there: Analyze | Dashboards | Historic Duty Statuses Dashboard
This section gives an overview of the Historic Duty Statuses Dashboard. It organizes and presents information in a way that is easy to read and refine onscreen. Live data is gathered from all over the system before being combined and presented for the audience in an appropriate format.
This dashboard displays all historic time and attendance activity, including successful and failed clocks and the reasons behind this.
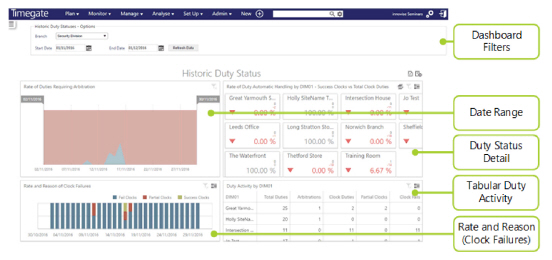
The screen is logically broken down into five sections - Dashboard Filters, Date Range, Rate and Reason of Clock Failures Graph, Duty Status Detail and Tabular Duty Activity as shown below:
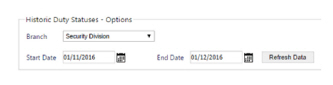
Dashboard Filters
Screen Layout, Fields and Actions
|
Branch |
Select the Branch to be analyzed from the drop-down list |
|
Start Date |
Using the pop-up calendar, select the start date for the data to be analyzed in the dashboard |
|
End Date |
Using the pop-up calendar, select the end date for the data to be analyzed in the dashboard |
Screen Actions
|
Refresh Data |
Update the view based on the values entered into the dashboard filter |
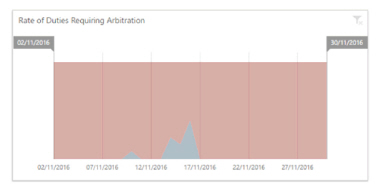
Date Range
This part of the screen shows the “rate” of duties that required arbitration historically, based on the percentage of total duties in the system that day. The blue area represents duties that required attention. Those items in red represent successful duties that required no attention. The user is able to modify the date ranges to display (as the graph contains a moveable slider).
Screen Layout
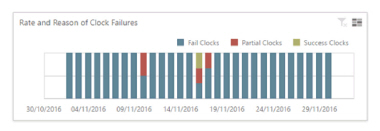
Rate and Reason Clock Failures
Breaks down only the duties from (1) that were due to issues in clocking in or out, showing the percentage against the total number of duties:
-
Fail Clocks – missing clock in and missing clock off
-
Partial Clocks - missing clock in or missing clock off
-
Success Clocks – Duty was successful clocked in and clocked out
Clicking on this graph will alter the values in the two screen areas detailed below.
Screen Layout
Duty Status Detail
This part of the screen shows a visual summary of all of the duties, broken down by type and branch.
Screen Layout
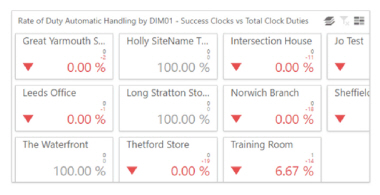
From this view, you can toggle between Success Clocks and Arbitrations Vs Total Duties. When done, this changes the state of the data displayed.
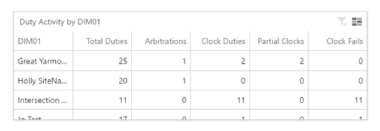
Tabular Duty Activities
This part of the screen shows a tabular summary of all of the duties, broken down by type and branch.
Clicking a row will filter the duty count bar chart and grids above.
Clicking headers will sort the rows either ascending or descending.
Screen Layout