Analyze: Dashboards - Event Status
Note: This content is applicable to the legacy web version of Timegate.
How to get there: Analyze | Dashboards | Event Status Dashboard
This section gives an overview of the Event Status Dashboard. It organizes and presents information in a way that is easy to read and refine onscreen. Live data is gathered from all over the system before being combined and presented for the audience in an appropriate format.
The dashboard enables the user to see, in real time which employees are booked onto Events. The user can see the number of employees who have clocked on for an event, with totals by role and team. Additionally, the can break this information down to an employee level. This is to give the user the confidence that the right number of people are in position at the correct time so that the event will run smoothly.
Note: This dashboard is only relevant if you use the licensed Timegate Events Module.
The screen is logically broken down into five sections - Dashboard Filters, Event Status Summary, Event Status Detail, Roles and Teams as shown below:
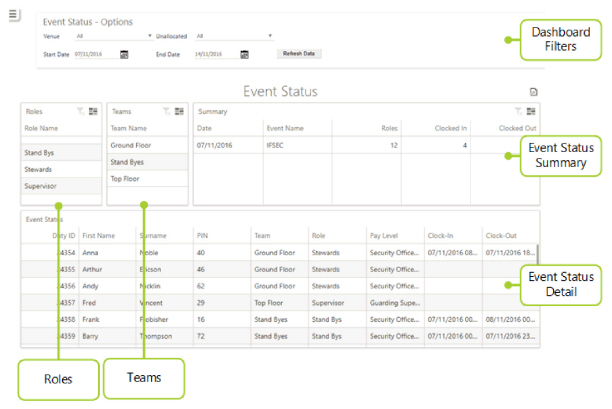
Dashboard Filters
Screen Layout, Fields and Actions
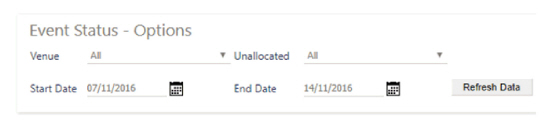
Allows the user to configure the dashboard. They are able to select the “level” to build the dashboard by - be that a single event or all events, the event dates and also whether unallocated duties are to be included or removed in the
Event Status view
|
Venue |
Drop-down list allowing the user to build the dashboard by a single event at a venue or across all events |
|
Unallocated |
This drop-down list enables the user to remove or include the Unallocated Duties in the Event Status view. Users should click on the drop-down and select the option to “Exclude Unallocated Duties” from the view. When the Refresh Data Button is clicked, the dashboard will only include active/scheduled duties |
|
Start Date |
Using the pop-up calendar, select the start date for the data to be analyzed in the dashboard |
|
End Date |
Using the pop-up calendar, select the end date for the data to be analyzed in the dashboard |
Screen Actions
|
Refresh Data |
Update the view based on the values entered into the dashboard filter
|
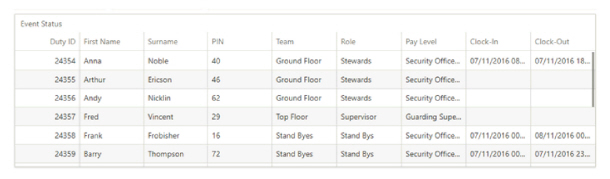
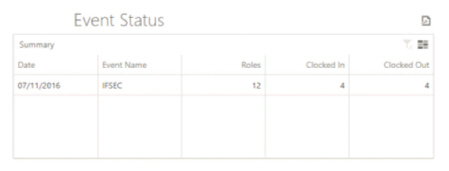
Event Status Summary
This part of the screen displays the Event Name, Staff Names and details along with the Teams and Roles and any time and attendance records activity associated to the event. Clicking on any label will sort the data in ascending/descending order as required.
Screen Layout
Event Status Detail
This part of the screen shows the date(s) of the event(s) along with the Event Name, Number of Roles, how many staff have clocked in and how many have clocked out of the event. Clicking on a row in the “Summary” section will filter all other sections to just include data from the selected single event.
Screen Layout
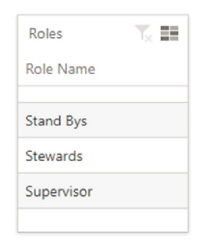
Roles
This part of the screen lists all of the roles assigned to the selected event. Clicking on an individual role will update the data in the Event Status view.
Screen Layout
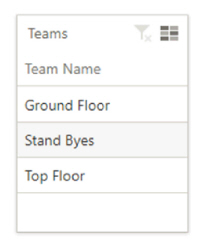
Teams
This part of the screen lists all of the teams assigned to the selected event. Clicking on an individual role will update the data in the Event Status view.
Screen Layout