Analyze: Dashboards - Duty Call History
Note: This content is applicable to the legacy web version of Timegate.
How to get there: Analyze | Dashboards | Duty Call History Dashboard
This section gives an overview of the Duty Call History Dashboard. It organizes and presents information in a way that is easy to read and refine onscreen. Live data is gathered from all over the system before being combined and presented for the audience in an appropriate format.
The Analyze Duty Call History Dashboard shows employee time and attendance activities. Below shows the sites and employees who made the calls, the expected time and the actual time the calls were taken. Plus, if a call was manually taken the comments added by the control room staff are also visible.
Using the filters, you can report on an abundant amount of calls and types.
The screen is logically broken down into four sections - Dashboard Filters, Duty Call History Date Range, Branch Calls Data Graph and Branch Calls Data Grid as shown below:
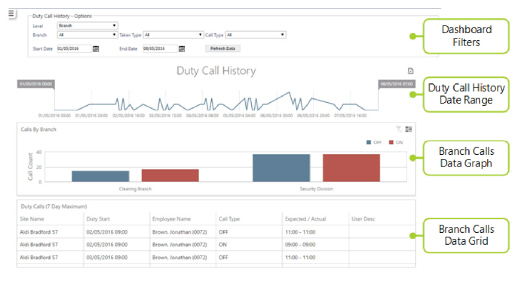
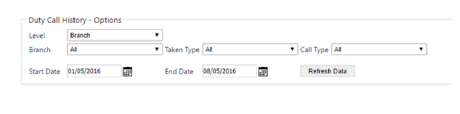
Dashboard Filters
Screen Layout, Fields and Actions
|
Level |
Drop-down list allowing the user to build the dashboard by Branch or Call Monitor View |
|
Branch |
Select the Branch to be analyzed from the drop-down list |
|
Taken Type |
This drop-down list allows the user to specify the call taken type. The user can also to choose to view the call data for all call types. The choices in the drop-down list comprise: All, Manual, Telephone, Biometric Device, Automated Logon, Automated Check, Automated Logoff, Automated Missed Logon, Automated Missed Check, Automated Missed Logoff, Automated Forced Logon, Automated Forced Check and Automated Forced Logoff |
|
Call Type |
Select the call type from the drop-down list. The options available are All, On, Check, Off, On Site and Off Site |
|
Start Date |
Using the pop-up calendar, select the start date for the data to be analyzed in the dashboard |
|
End Date |
Using the pop-up calendar, select the end date for the data to be analyzed in the dashboard |
Screen Actions
|
Refresh Data |
Update the view based on the values entered into the dashboard filter |
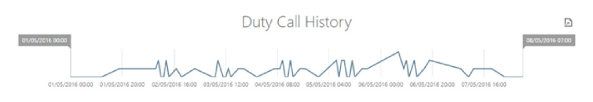
Duty Call History Date Range
The line graph shows the total call activity (matching the selected parameters) within the period being queried. Within this part of the screen, the user is able to modify the date ranges to display (as the graph contains a moveable slider that is employed to change the date ranges of the display).
Note: A maximum of seven days are shown within this dashboard.
Screen Layout
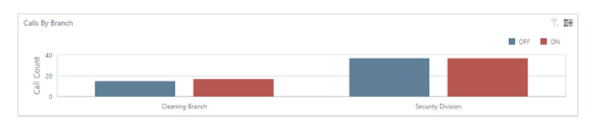
Branch Calls Data Graph
This part of the screen shows the Duty Calls Branch Graph - a visual representation of the representation of the On/Check/Off/On Site/Off Site calls for each Branch/Call monitor view. Clicking on any of the bars in the graph will update the lower portion of the dashboard which displays a breakdown of all the calls that make up that graph.
Screen Layout
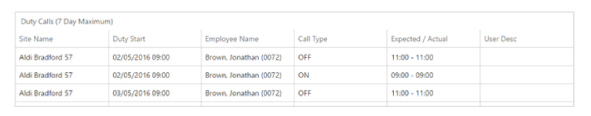
Branch Calls Data Grid
This part of the screen shows the Duty Calls Branch Graph - a tabular representation of the On/Check/Off/On Site/Off Site calls for each Branch/Call Monitor View. Clicking on any of the headings will sort the data by sites, employees, times and call types.
Screen Layout