Analyze: Dashboards - Current Duty Statuses
Note: This content is applicable to the legacy web version of Timegate.
How to get there: Analyze | Dashboards | Current Duty Statuses Dashboard
This section gives an overview of the Current Duty Statuses Dashboard. It organizes and presents information in a way that is easy to read and refine on screen. Live data is gathered from all over the system before being combined and presented for the audience in an appropriate format.
The Analyze Current Duty Statuses Dashboard gives an overview of duties that have not been successfully completed and require some level of user intervention. It gives a visual display of duties that either require arbitration, are failed duties or are partially clocked (i.e. clocked in, but not clocked out).
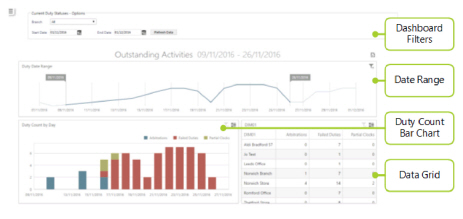
The screen is logically broken down into four sections - Dashboard Filters, Date Range, Duty Count Bar Chart and Data Grid as shown below:
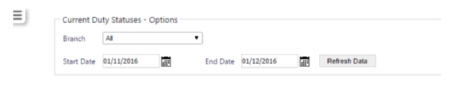
Dashboard Filters
|
Branch |
Select the branch to be analyzed from the drop-down list. The user can select a single branch or a selection of branches. |
|
Start Date |
Using the pop-up calendar, select the start date for the data to be analyzed in the dashboard |
|
End Date |
Using the pop-up calendar, select the end date for the data to be analyzed in the dashboard |
Screen Layout and Fields
Screen Actions
|
Refresh Data |
Update the view based on the values entered into the dashboard filter |
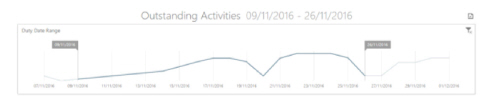
Date Range
This part of the screen shows a line graph of the duties that require an activity for the selected branch over the specified date range. Although there is currently no scale on the graph, it can be used as an indication of duty performance over time. The dates used in this filter can be dynamically amended by moving sliders within this graph.
Screen Layout
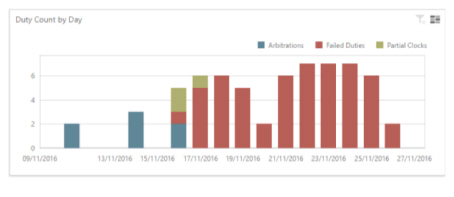
Duty Count Bar Chart
This part of the screen shows graphically, a breakdown of Arbitrations, Failed Duties and Partial Clocks by day and site respectively. Clicking a bar on the graph will filter the data grid on the right (detailed in the Data Grid section below).
Screen Layout
Duties are color coded based on the reason for action as shown:
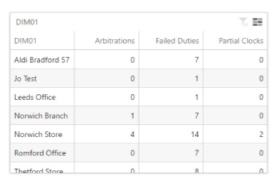
Data Grid
This part of the screen shows in a tabular format, a breakdown of Arbitrations, Failed Duties and Partial Clocks by day and site respectively. Clicking a row in the table will filter the duty count bar chart (detailed above in the Duty Count Bar Chart section) and clicking on the headers will sort the table.
Screen Layout